
CHROME STYLE DEV TOOLS ON MOBILE WITH IONIC (ERUDA)

I found myself wanting more debugging information while working on a personal Ionic 4 app. When something goes wrong I would like to be able to read the logs right then and there on app deployed to iOS.
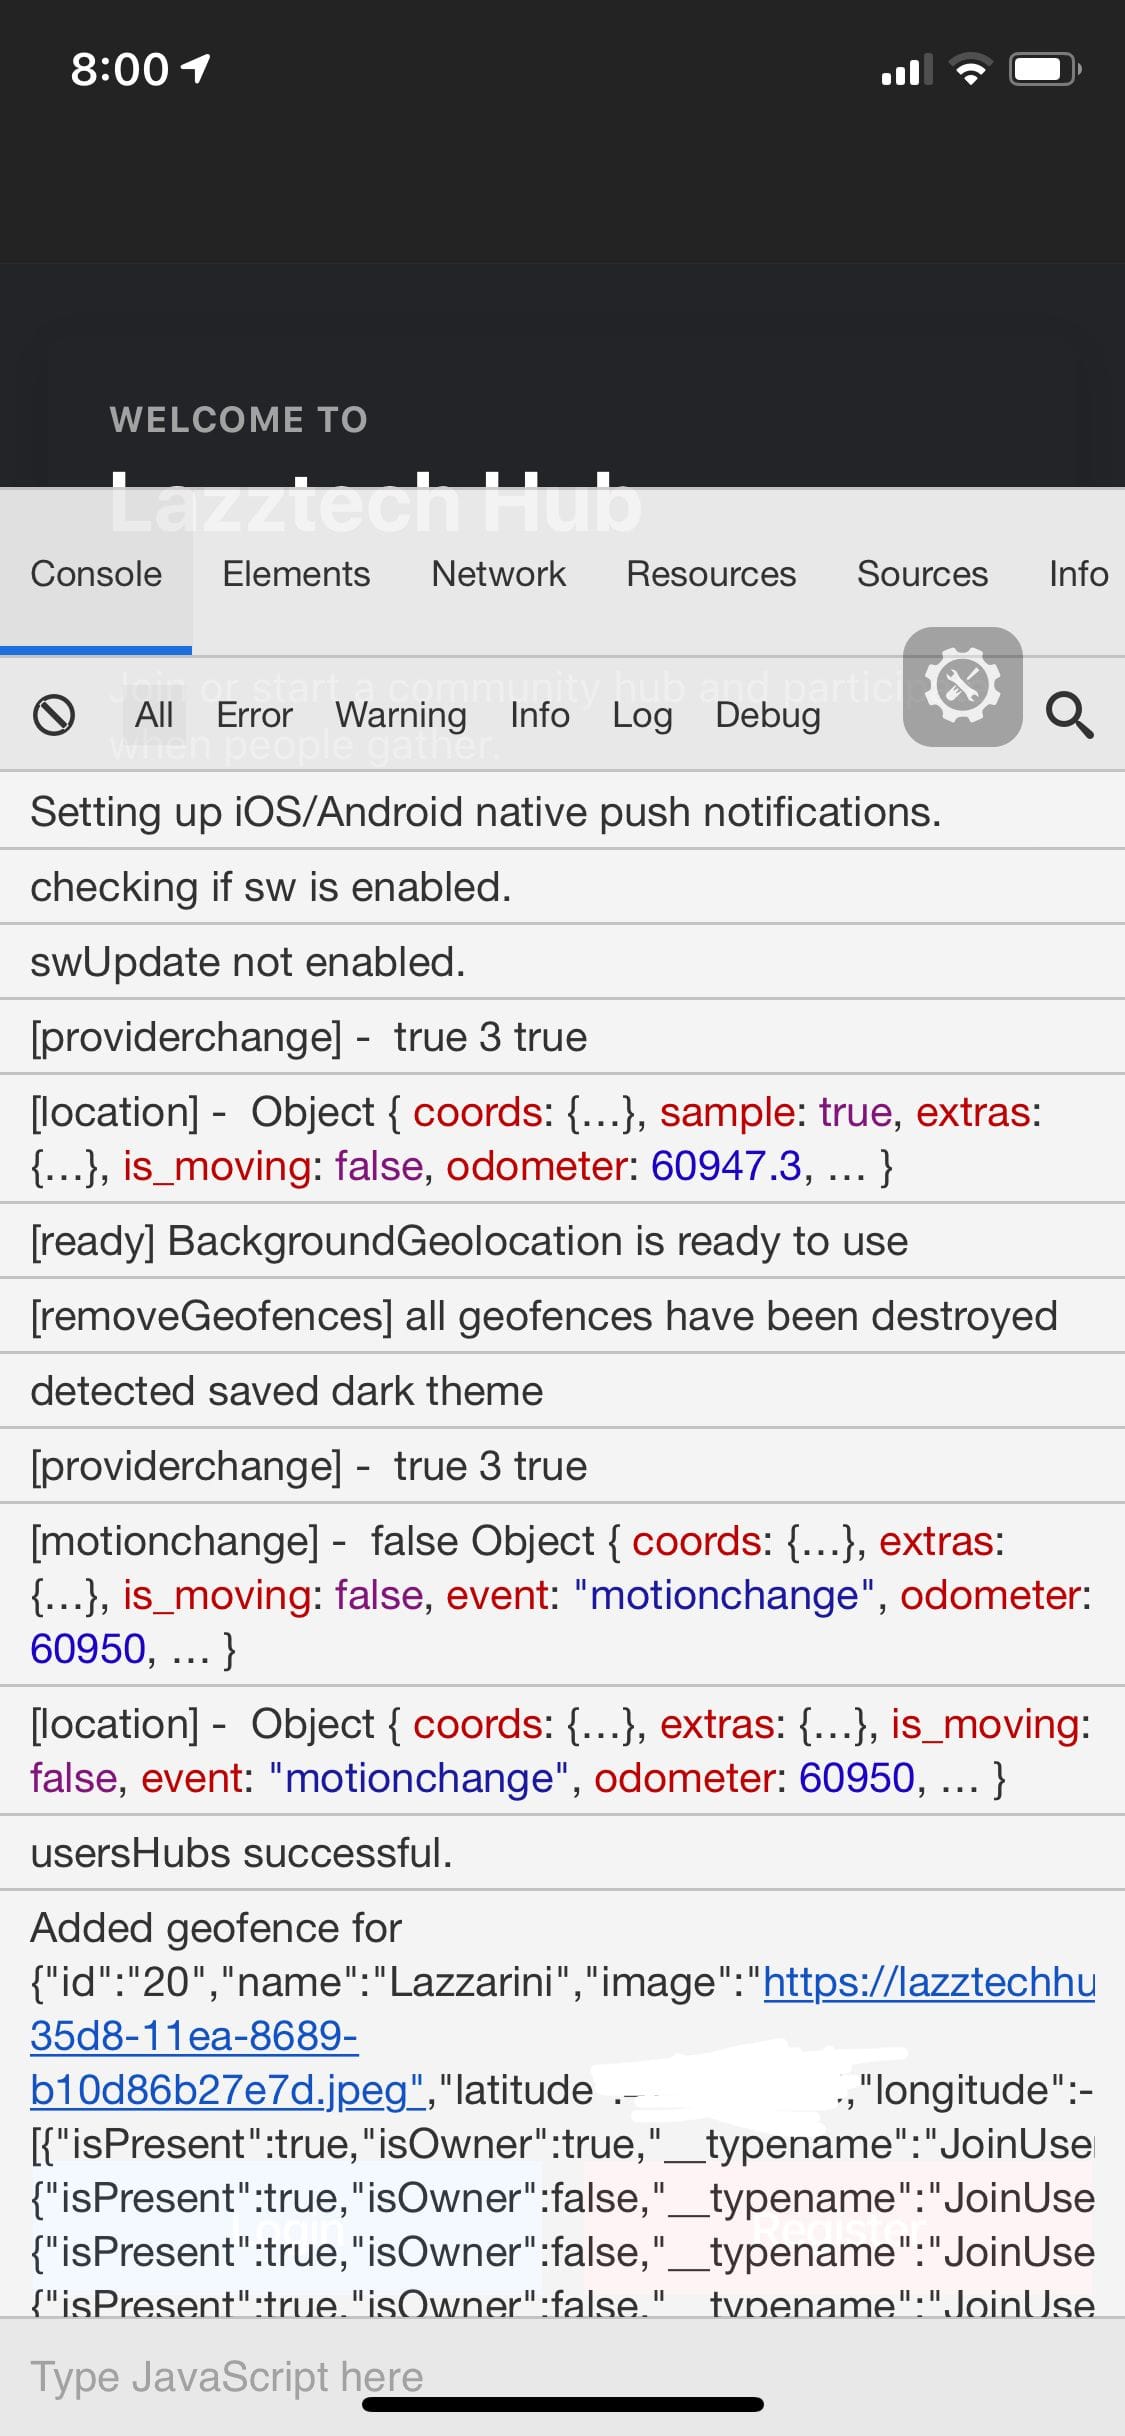
I’m going to share with you how I used a project called Eruda to add a javascript based implementation of your common browser dev tools. This project allows you to have access to such information while viewing a page on mobile.
In my ionic app’s root project directory I ran the following to set things up:
npm install eruda --save
Then I created an angular service to enable the eruda dev tools from within the app:
ionic g service debugger
I implemented the newly created angular service as follows:
import { Injectable } from '@angular/core';

import eruda from 'eruda';

@Injectable({
  providedIn: 'root'
})
export class DebuggerService {

  constructor() { }

  start() {
    eruda.init();
  }

  stop() {
    eruda.destroy();
  }
}
Then I imported the service in the app.component.ts and called the .start() method:
  constructor(
    private platform: Platform,
    private debuggerService: DebuggerService
  ) {
    this.initializeApp();
  }

async initializeApp() {
    this.platform.ready().then(async () => {
          this.debuggerService.start();
    }
}
I haven’t seen this setup documented anywhere and I think it can be a powerful tool for Ionic developers.